
Grabbing consumers’ attention is tough in today’s social media-driven society. Break through the noise & allow your content to go further with these 5 tips.
Content marketing has quickly become one of the most important marketing strategies businesses practice today. Over the past few years, even initially skeptical businesses have little by little realized they need to work content marketing into their marketing programs. Searches for the term have steadily risen and 86% of B2C marketers now say content marketing is an important part of their marketing program.
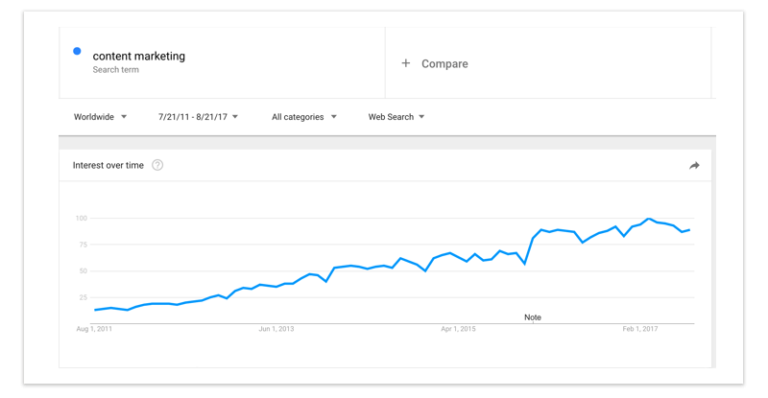
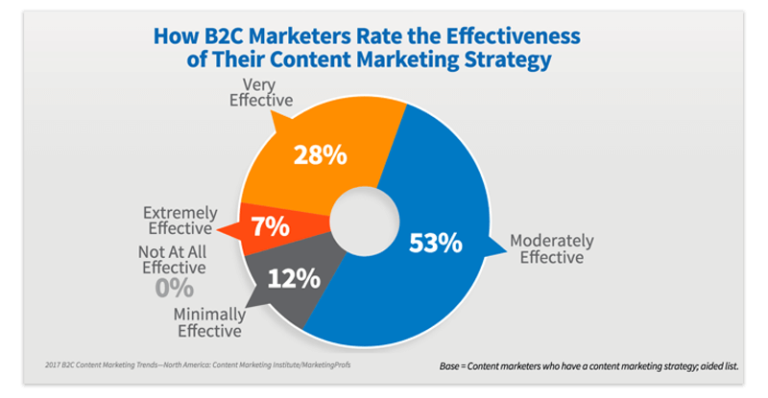
If you want to build a presence online, producing high-quality content that’s optimized for SEO isn’t optional – it’s an important part of the process. As undeniably important as content marketing is, only 35% of those same B2C marketers say their content marketing is effective.
The common consensus seems to be that content marketing should be treated as a necessary part of every company’s marketing mix – and yet, results aren’t a given.
The Challenges of Making a Dent with Content Marketing
Every day, millions of new blog posts are published on the web. Every time you pull up Twitter or Facebook, you can scroll through hundreds of posts. How many times in a day do you see a link that you could click on, but scroll on past without bothering to?
That’s what you compete with when you do content marketing. You’re not just up against the content created by your competitors. You have to grab the attention of your audience while showing up alongside hundreds of other things they could be paying attention to instead, and that includes things like their friends’ baby pictures, entertainment gossip, sports news – stuff you’re going to have a hard time competing with no matter how great your content is.
For your content to rise in the search rankings, you face an uphill battle. Most of the factors Google’s algorithm looks at to determine which websites are authoritative depend on people already having found your site. You can’t get high traffic, lots of links and shares, and people spending long amounts of time on your website if they never manage to learn about your content to begin with. Your odds aren’t helped at all once you learn that companies with big budgets are able to launch multiple sites that all link to each other – boosting their own rankings at the expense of everyone else.
For content marketing to work in the face of this kind of competition, creating lots of content isn’t enough. Making sure the content is unique and high quality isn’t enough. Even amazing content that’s like nothing else out there won’t make a mark unless you also commit to content promotion.
5 Content Promotion Strategies to Make Your Content Go Further
The businesses that started doing content marketing in the early days of the internet had it easy. They could publish reasonably good content, gain an audience, and build authority without many other competitors in their space competing for their audience’s attention. Now, almost every industry has lots of different companies pushing out blog posts, ebooks, webinars, and videos. Promotion wasn’t always a required component of content marketing, but today it really is.
When you’re working out your content strategy, make sure to give promotion tactics a decent share of the schedule and budget. If you’re not sure what your promotion efforts should look like, consider these five options to start with.
1. SOCIAL MEDIA PROMOTION
Social media is one of the most obvious places to turn to for content promotion, but social media promotion is not often done well. Many businesses write up quick summaries or teasers for their blog posts, push them out onto social media with a link, and hope for the best.
That may get you a hit here and there for your content, but unless you already have a pretty big and reliable following, it won’t get you that far. To be competitive on social media, you have to spend time on the social media channels you use building relationships and growing your influence. How much more likely are you to click on a link from a source you know and trust, versus a brand you’re barely familiar with?
There are a few best practices for social media promotion that will help you both get more eyes on your content and develop relationships on your social media channels.
1. Use paid social ads.
Getting traction on social media is hard, especially early on before you’ve gained many loyal followers. If you’re having a hard time getting anyone to see your posts and follow you, then a lot of the time you spend on social media is wasted.
If you struggle with the idea of spending money on a platform that’s free to use, just think of how much money your wasted time is worth. To help you get more followers and more eyes on your content, it’s worth investing in social media ads. And for most social media channels, the ad options include extensive targeting opportunities, making it easier to specifically reach the people in your target audience.
2. Tap into the community.
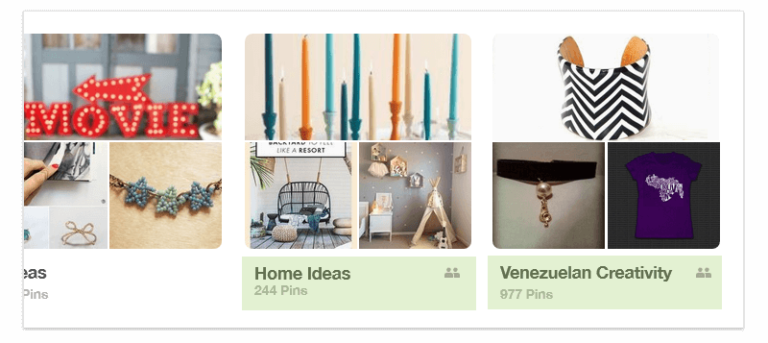
One of the best free ways to find and attract people in your audience on social media is to go where they’re interacting with each other. Facebook and LinkedIn have Groups you can join and participate in, Pinterest has group boards you can contribute to, and you can research relevant Twitter chats to jump into as well. Interacting with people in these channels gives you a chance to get on their radar and start to develop a relationship with them.
While participating in these communities, look for opportunities to share your content, but don’t force it. You don’t want to just drop links, as that would make you look too promotional. But if someone asks a question your content answers, or if a topic comes up that you’ve created content about, that’s a good opportunity to point people toward your content.
3. Interact with your followers and others in your target audience.
What makes social media work is that it’s social. If it were all just people talking at each other rather than with each other, it would have far less appeal. So use that. Follow your followers so you can reply to things they post. Pay attention to their followers and those of your competitors and industry influencers, and follow relevant hashtags in order to look for more opportunities to join the conversation. By becoming a helpful part of the relevant conversations happening around your industry, you can start to attract the attention of anyone paying attention to those conversations on social media.
4. Share other relevant content.
Don’t just share your own content; share the love by generously re-tweeting and sharing helpful content from other sites. Whenever you read a good article that you think your audience would appreciate, let them know. Showing a willingness to share good content from your competitors and other industry sources may feel unintuitive, but it’s a good way to win trust and provide value to your followers.
5. Share your content multiple times.
We’ve talked a lot about ways to build your following without sharing your own content, but the overall point of everything on this list is to get people to see your content. So in the midst of all that other stuff you do on social media, you should also share links to each piece of content you create multiple times.
If you worry that sharing the same link several times will seem like you’re spamming people and they’ll be annoyed, silence that voice in your head. Social media moves fast. For people to actually see the content you share, you have to get it out there more than once. So write up some teasers and descriptions and schedule that post or ebook to go out several times over the next few days and weeks.
6. Customize your messages for the platform.
The people who follow you on multiple social platforms don’t need to see the same message in three different places, and people are often looking for something different when they’re on different platforms. Take the time to promote your content in different ways on each website.
Pay attention that what generally works on each site and craft a message that’s suited to the medium. For example, Facebook gives you more characters to work with and you could, therefore, pull a particularly good excerpt from a piece of content that will drive people to the post, where on Twitter you have to craft a simple line that tells people why to click. Spending the extra time to tailor those messages will increase how well they perform across the platforms and save you from annoying your most devoted followers.
These are general recommendations, but as with anything in marketing, test out what works best for your audience. Pay attention to your analytics as you go and tweak your social content promotion campaigns accordingly. Social can be a powerful way to reach your audience, but it’s tricky to do well. The only way to know what’s working is to pay attention to your results.
2. PAID SEARCH
While a good content strategy should definitely emphasize SEO, making headway in organic search results is slow. And as previously mentioned, many of the factors search engine algorithms use to decide sites deserve a high ranking depend on people finding your site to begin with, which is the whole point of SEO. It’s a frustrating cycle, but you do have a shortcut to making sure your content is found on Google: paid search.
Paid search marketing not only provides more (and faster) visibility for your content, it also offers valuable targeting opportunities. As with social ads, you can select who will see your ads based on demographic factors, as well as targeting relevant keywords.
Here are a few tips on using paid search for content promotion that you should be aware of:
- Stick with paid search general best practices. All the things your PPC specialists normally do – keyword research, targeting, well-crafted copy and CTAs – applies when promoting content just like it does for product ads.
- Promote your best content. It’s probably not worth spending the money to promote every single blog post you put out. The content that you put the most work into creating that you know provides information important to your audience should be prioritized.
- Take advantage of the clicks you get. If you’re going to pay for those clicks, make sure you make the most of them by including strong CTAs in the content you promote to help turn that first click into an ongoing relationship.
- Use your analytics. Pay attention to what your PPC analytics tell you about what’s working. You can use that information to both improve the success of your PPC campaigns and strengthen your content strategy.
Of all the promotion strategies on this list, paid search is the fastest way to get your content in front of people. A lot of content promotion involves playing the long game, but this is one tactic where you can reach people right away. If you can keep their attention once you’ve gained it with paid search, the tactic can be a powerful way to build your audience faster.
3. EMAIL MARKETING
Email marketing functions simultaneously as a form of content marketing, and one of the best tactics you have to promote your content. For email marketing to be effective, you first have to build an email list – something that these other promotion tactics and the strength of your content will help with. Once someone has opted to receive marketing emails from you, email marketing is the best tool you have to keep the relationship going.
Tips to Build Your List
As soon as you have the attention of someone in your audience, you want to use the opportunity to try to get them on your email list. Some of the best ways to do that include:
- Including an email signup box on each page of your website and content. Make it hard to miss. If someone’s interested in your emails, it should be as easy as possible for them to take that step.
- Using gated content. Put your most valuable content behind an email signup form.
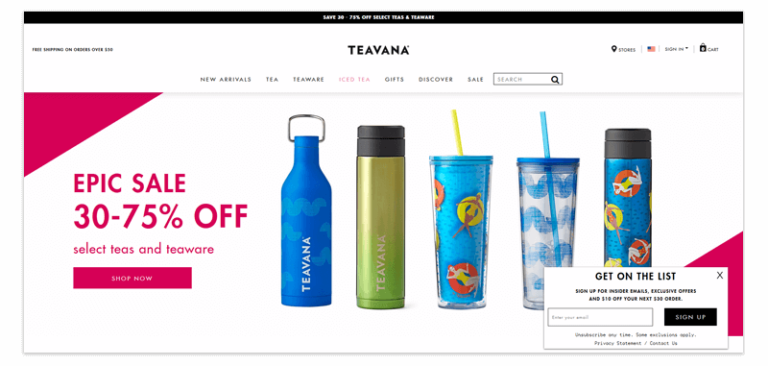
- Offering discounts or specials. A promise of 10% off for your first order after signing up or a free extra is a strong incentive for some consumers.
- Providing options. Some people will be annoyed by the idea of emails every day, while others prefer it. Some will be more interested in deals than content, and some will want more educational emails than promotional ones. The only way for you to figure out which subscribers are which is to let them decide. When they’re signing up, give them options for the frequency they prefer, topics they’re interested in, and types of emails they’d like to receive.
Tips for Promoting Content to Your List
Once your content has captured them, your emails serve as a way to get more of your valuable content in front of them. To make the most of the opportunity:
- Use segmentation. Don’t just have one list, have several, especially if your content covers a variety of topic areas that appeal to different personas. A prospect that signs up to your email list from a piece of content about mixers will be more interested in content about baking than about interior design. Receiving only relevant content ups their chances of staying subscribed and clicking through.
- Provide something unique in emails. Your emails should helpfully let them know about new content you publish, but make sure you also give them something extra that non-email subscribers don’t see. Whether that’s discounts or unique content you create just for the emails.
- Use images. Images make their email experience better and increase the likelihood that they’ll click through to your content.
- Pay attention to analytics. Email marketing programs provide detailed analytics that can help you track how well your different emails perform. Use that information to figure out what works best for your different lists and tailor future emails to what they respond to.
- o A/B testing – Most email marketing software also provides features that enable A/B testing. Make use of the option to better learn what specific tactics and styles work best in your emails.
Email marketing has an edge over other types of content promotion because you’ve already got your audience built in. Take advantage of that and make sure you provide enough value to keep the audience you’ve worked to gain.
4. GUEST POSTS
Strategic guest posting is a good way to get your brand in front of a new audience and drive people to your content. It requires a lot of work – you have to create high-quality content for someone else’s blog, usually for free – but it can pay off in new followers and links that strengthen your SEO.
A successful guest blogging strategy requires five main steps:
1. Research relevant blogs.
Spend some time compiling a list of blogs that people in your target audience are likely to be reading. You can start by simply Googling relevant keywords. If you sell gardening supplies, for instance, search for “gardening blog guest post” and start browsing results to look for blogs that appear to be a good fit and accept guest posts.
As you explore these blogs, pay attention to the blogs they link to and reference, as these are likely to provide more opportunities for you. And in your social media interactions with people and brands in the industry, pay attention to the blogs that get shared frequently and check them to see if they accept submissions as well. With just these few steps, you should be able to start creating a decent list of blogs to target in your guest posting efforts.
2. Study each blog on the list before you pitch.
The blogs most worth guest posting on are likely to be getting a lot of pitches already, so you have to make sure yours is both good and relevant to the topics they cover. Spend some time browsing the blog to see the different types of posts they publish and topics they cover.
Pay attention to how long the posts are, the types of headline constructions they tend to go for, and which posts seem to be the most popular (if they have an active comments section, the number of comments is a good indicator of this). Once you have a pretty good idea of the kinds of posts common on the blog, then brainstorm relevant ideas to pitch. Before you actually send your pitch, double check the idea you send hasn’t already been done. And read the guest post submission guidelines to make sure you follow all the instructions.
3. Write well-researched, high-quality posts.
This step doesn’t need much explaining. If you’re doing content marketing for your own site, you already know the drill. Just make sure you don’t skimp here, it has to be good if you want them to publish it and, just as importantly if you want to get their audience to go check out more of your content.
4. Include a link back to your own posts.
To get some SEO benefit from the work you put into your guest post, make sure to include a link back to a piece of your own content. Don’t try to force it – the link has to be natural. And don’t try to stuff a bunch of links in there, the website you’re sending this to will notice and won’t let that fly since it makes them look more spammy. But most websites that accept guest posts will be ok with one or two links to relevant, helpful content.
5. Include a CTA in your byline that drives people to a high-value piece of content.
In addition, you can use your byline to include one more CTA to encourage people to check out a piece of content you’re confident will be valuable to them. This is a good opportunity to push them toward some of your longer, more comprehensive pieces like an ebook or guide (possibly gated, so you can capture their email address as well). Make sure the content you’re pushing them toward is relevant to what you covered in the post – the audience is less likely to care if it’s on a completely unrelated subject.
While it may feel frustrating to hand some of your best content over to someone else to publish, guest posting is a proven strategy for building an audience and links. If you choose the right blogs and your guest posts impress, you’ll start to build up a reputation in your space and gain new followers along the way.
5. INFLUENCER MARKETING
Influencer marketing includes a pretty broad category of tactics that has a lot of overlap with some of the other promotion tactics we’ve already described. The goal is to identify and develop relationships with people and brands in your industry that already have a large following of the people in your target audience. If you can use their influence to build trust in your brand, that’s powerful.
One of the most important principles you have to keep in mind when practicing influencer marketing is that the relationship has to be mutually beneficial and you’re starting from a place where they likely have more to offer you than you can offer them. That means you have a couple of options to figure out how to make it worth their while.
Your Fastest Option: Pay them or offer free products.
Free products can earn you reviews or mentions, direct payment can result in content on their website and social profiles that promotes your product for you.
The Low-Cost (But High Time Commitment) Option: Build a relationship.
This option is a much slower process and there are no guarantees it will pay off, but if it does you could end up with a genuine supporter of your brand and product, which will build trust with your audience more effectively than paid influencer recommendations. This option requires taking time to interact with influencers in ways that provide value to them. That can include:
- Sharing their content,
- Interacting with them on social media
- Commenting on their blog posts
- Pitching a guest post for their blog
- Attending events they’re at to meet them in person
Basically, you want to look for any opportunity to start and nurture a relationship in the hopes of becoming friendly professional contacts. If the relationship is genuine and they like your product, they may be willing to recommend it to their followers, work on co-creating content with you, and find other ways to collaborate with your brand.
You may not need to use all of these promotion tactics, but you’ll likely want to use a mix of them. Figure out which options make the most sense for your product and audience and work out a strategy to put them to use. Your content won’t accomplish anything until people start to see it. Use content promotion to make it easy for them to find.
If you need more help, our team of marketings experts is ready to create, manage, and maximize your content promotion campaigns today.


