

The 3 Most Important Facebook Ads Metrics for Understanding Campaign Performance
My fellow digital marketers – before we talk about Facebook Ads metrics, please complete this short survey.
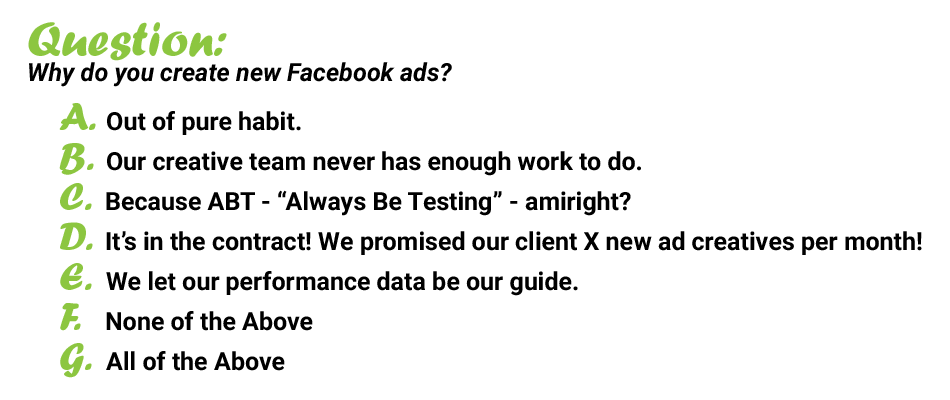
If you selected “E” above, then congratulations! You’re a super evolved digital marketer! Or…you’re just pretty good at kidding yourself. In reality, most of us are probably doing some combination of these different scenarios.
And for good reason. Today’s digital agencies face the same age-old issue as the traditional Mad-Men agencies of yore: their media and creative teams are siloed.
Too often, the media team lobs a request for “better” creative over to their design team without communicating why previous ads are (or are not) performing well. The creative team spends countless hours generating fresh new creative only to see that 99% of the time, the Facebook algorithm prefers the old, stale creative that was running before. But without an understanding of the performance, the feedback loop is never closed, and the creative team remains in the dark.
Bridging the Media-Creative Divide with Data
It’s time to bridge the divide between the media and creative teams, my friends. And – you guessed it – the material we’re building our bridge with is pure, raw, glorious data. It’s time for the media team to take the lead in the creative design process. Don’t worry – this doesn’t mean brushing up on Photoshop. This means leveling up your Facebook analytics skills!
Across the board, digital channels like Facebook are taking more and more optimization controls away from us advertisers. This means creative design is becoming more important than ever before. Indeed, it may soon be one of the only optimization levers we have left as digital marketers.
So let’s take back some control by getting better at analyzing creative performance, with the help of three key Facebook Ads metrics.
Ad Relevance Diagnostics: Facebook Metrics for Ad Creative Analysis
Here’s the good news: Facebook’s reporting metrics are now more sophisticated and insightful than ever. To name a few, here are three key Facebook Ads metrics that will help you understand your campaign’s performance. Collectively, they are known as Ad Relevance Diagnostics.
- Quality Ranking Metric – Facebook wants their users to have a high quality experience across their platform so they’ll return again and again and hang out for a while when they’re on Facebook, Instagram and other Meta platforms. This goes for ads, too.
Quality Ranking is Facebook’s measure of the perceived quality of your ad compared to other ads serving to the same audience. In other words, if your ads aren’t giving Facebook users a high-quality experience, your ad impressions will decline. Or, they may never gain volume in the first place.
- Engagement Rate Ranking Metric – Essentially, Engagement Rate Ranking is how much engagement Facebook expects your ad to get, including clicks, reactions, comments and shares. If Facebook believes your ad will get lower engagement compared to ads competing for your same audience, then they’ll be less inclined to serve your ad, resulting in fewer impressions and results.
- Conversion Rate Ranking Metric – Conversion Rate Ranking is a prediction of how likely someone is to complete your desired conversion goal after clicking on your ad compared to other ads competing for the same audience. If your landing page is slow, irrelevant or otherwise poor, and your historical conversion rate is very low, then you will likely see a lower Conversion Rate Ranking.
Facebook perceives a conversion as a sign that your customer has had a positive and useful experience after clicking on your ad. Therefore, Facebook will reward advertisers that achieve a high Conversion Rate Ranking by preferring and serving their ad more often.
In Facebook Ads Manager, you can pull all three of these Ad Relevance Diagnostic metrics right into your performance dashboard at the ad level.
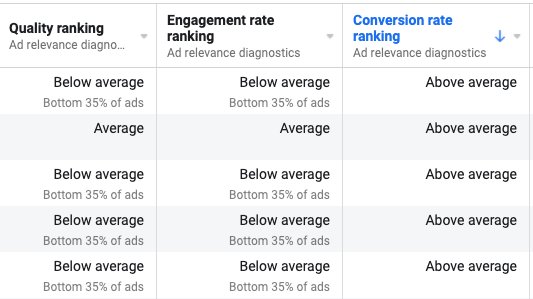 Source: Facebook Ads Manager
In the example above, you can see that the ads in this campaign are receiving an “Above average” conversion rate ranking. In other words, Facebook predicts that once someone clicks on the ad, they are very likely to convert. This means the experience of the landing page (design, copy, CTA, functionality, etc.) are effective at getting the audience to convert.
However, you’ll also notice that most of the ads in the campaign are receiving a “Below average” score for the Quality Ranking and Engagement Rate Ranking metrics. In other words, good luck getting someone to actually click on the ads.
With a below average Quality Ranking and Engagement Rate Ranking, Facebook will significantly limit the number of impressions these ads get. As you know, you can’t get conversions if you don’t get clicks, and you can’t get clicks if you don’t get impressions.
So, in this case, it doesn’t really matter that the Conversion Rate Ranking is fantastic, because no one is going to see the ad in the first place!
Now, let’s think about if the reverse were true. Let’s say your Quality Ranking and Engagement Rate Ranking were killing it, but your Conversion Rate Ranking was in the toilet. Your stellar Quality and Engagement metrics will keep your impressions and clicks afloat for a little while. But, you’ll end up wasting a decent amount of budget on clicks that go nowhere. Eventually, Facebook will interpret your website’s failure to convert all of these eager clickers as a poor user experience. Your ad impressions will plummet, and you’ll have nothing to show for all that media spend 🙁
Final Thoughts
Don’t be that guy. Don’t be that guy with an amazing, high-converting landing page that no one ever gets to see. Also, don’t be that gal driving a ton of clicks (and cost) to a page that gives a poor user experience. In either case, Facebook’s ad algorithm will eventually catch up with you and reduce your ad impressions.
Instead, use the Ad Relevance Diagnostic metrics. With these three Facebook Ads metrics, you can lead the creative optimization process by starting with good, sound creative analysis.
More From Effective Spend